

Season 19 Playoff Picks: Another Skeeson, Another Skee Nerd
[Editor’s Note: I would like to say that I was completely caught off guard by this ghost writer. Last Thursday someone approached me about not only being a ghost writer, but about simulated team outcomes. I love stats and have a feeling this is going to be insane. Let’s rock and roll.]
Skeeson 19 Playoff Picks Predictions App
Hello everyone and welcome to the Skeeson 19 Team Playoffs Predictions! This skeeson we’re going to try something new (or rather, bring back something old): rather than randomly and baselessly saying “NOTHING MATTERS! IT’S THE PLAYOFFS AND ANYTHING CAN HAPPEN!!” (enter Ghost Writer from last season), we’re going to take a more analytical look at things. A while ago, we had a fantastic statistician named Lisa Ogawa [Editor’s Note: I miss Lisa!] who split her free time between crushing 50’s and using math to predict playoff performances. I don’t quite have the same statistical chops, so to resurrect the skee nerd report, I’m relying on the magical powers of these new-fangled computing boxes to simulate the playoffs for us over…and over…and over….again, then look at the outcomes from the simulations. Before we get into that though, let’s set the stage with what happened this skeeson.
This was one for the record books, folks. We had some of the best rookskee scores I’ve seen in many a-year, including the #5 all-time rookskee match score of 386 by the skeeson’s Rookskee of the Year, Jesse Sykes. Rookskees rolled 6 matches over 325 this skeeson, including 3 by Jesse. Look out for them in the HRT – you could be in trouble! But in some ways, the newbies are just an appetizer to the top of the leader-board, which saw 4 players average over 420 points – the most ever – and Pat isn’t even one of them! The final week of the skeeson was a heart-breaker for Nick, Everett, and Pinball, who could have rolled 35 points below their average and still held onto the MVSkee prize – they couldn’t do it, handing it to Devin on a silver platter. Everett was cursing, Nick stormed out in a cold fury, and I believe I saw a single, silvery tear trapped in Pinball’s coarse hedge of a beard. We’ll see if they can reassemble their shattered dignity in time to bounce back during the playoffs.
Beyond the top four we saw some ups and some downs. Max made a 30-point jump in average from last skeeson to snag the #12 spot, while Ben Fountain swung 70(!) points the other way as he came crashing down to earth from the draft skeeson. Jeff Wagner learned to roll hundos, while Steph seems like she may have forgotten for a little while. Kyle Sherry and Chelsea Jensen came back and showed that they’ve clearly been practicing for the past 3 years, while Ray and his quiet, 900-rolling teammate J.K. disappeared into the autumn sunset. We saw 81’s from players who average just over 300 (Diana), and 18’s from players who average over 400 (too many to name). It’s been a wild ride.
With everything that has happened this skeeson, how could we possibly predict anything for the playoffs? Well, with everyone’s favorite friend from high school, math! (Actually, having seen Jerry in the playoffs, I think we can all agree that math isn’t for everyone). [Editor’s Note: haha so true!] “But Skee Nerd, how can we determine everyone’s chances in the playoffs?”, you ask? Well, let me tell you.
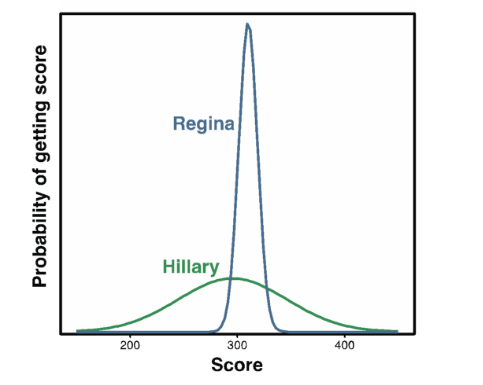
We’re all familiar with the concept of average (or “mean”) score. What some of us may remember from statistics is that we can also calculate the standard deviation of our performance, which basically indicates how much our scores varied from match to match. If you’re Regina, whose scores were all within 20 points of one another this skeeson, you’ll have a very low standard deviation; if you’re Hillary Millett, who swung between 401 in week 2 and 221 in week 8 [Editor’s Note: that’s Brian Aldridge type stuff right there… but at least she broke 200!], it’s going to be much higher. (Seriously though, Hillary? What?) If we have a mean and a standard deviation for a player, we can make weighted random draws from a normal probability distribution to pick possible scores that player could have rolled. See below for a picture of what these distributions look like.
Once we have these probability distributions for each player in the league, all we have to do is simulate matches by randomly drawing scores from the probability distributions for each player on both teams. The team with a better score advances to the next round and we repeat the process through the bracket until we have a winner. “But Skee Nerd”, you say, “this all seems pretty made up. How could one randomly selected score represent what’s actually going to happen?” Well, dear reader, it can’t. As you so astutely pointed out, a single simulation is no better than saying “I know for certain what score Certified Choke Artist Nick Weir [Editor’s Note: shots fired!] is going to roll in the next match based on his score from the regular skeeson.”* But, if we simulate over and over again, patterns in performance can emerge. We can determine teams’ chances of winning or losing every match, identify possible upsets, and figure out how likely each team is to go home with a sweet, sweet chalice on Saturday, November 18th [Editor’s Note: Super Saturday plug, well done].
So that’s what I did. After calculating every player’s performance probability distribution, I simulated the playoffs all the way through 10,000 times, from the play-in rounds through the championship. Before I go any farther, you can look at the simulation results yourself: click here to peruse the bracket and see how your team is likely to do. You can look at your probability of winning each match in the bracket at the top, filling it in as you like using the match options in the side-bar. At the bottom, you can check how good your team’s chances are of making it to each round. Given that all the results are online, I’m not going to go match-by-match through the bracket, but instead highlight some interesting points revealed by the simulations. [Editor’s Note: I’m nerding out right now. The Season 19 Playoff Picks are awesome!]
First off, let’s talk about the bottom of the bracket. In 10,000 simulations of the playoffs, only once did a play-in team win a chalice, when SMFAO took everything home. In the words of Dr. Who, it’s “Not impossible. Just…a bit unlikely”. However, they can definitely cause some havoc! In 17% of simulations, a play-in team upset one of the top three seeds. This makes seeing one of the top 3 teams go down in flames about as likely as rolling a six on a die in one roll – it can happen! In 25% of the simulations, a bottom half team made it to the Final 4! Similarly, the top 4 teams rarely all made it through unscathed to Super Saturday: this only happened 14% of the time. You all know how much Duke loves upsets, and the numbers say we could see a few! [Editor’s Note: the numbers don’t lie. Neither does history. And history says we are going to see some upsets!]
This approach says that there are a few teams ripe for the picking, and a few where something wild would have to happen to see them win or lose a big match. The playoff team with the most variability over the course of the skeeson was Pinball and the Machines (amazing name) who swung between 1152 in Week 1 and 888 in Week 6. There are two totally different versions of that team which you could be facing come Thursday, and we can only wait until then and see which one shows up**. In contrast, there’s Total Eclipse of the Hundo at #1, who averaged 55 points more per week than any other team in their record-setting skeeson. The team with the best chance of beating them (Max, Chuck, and Jen of Finding 40’s) has the same chance of beating Nick, Kyle, and Jeff as the likelihood of flipping a coin twice and getting heads both times. However, Finding 40’s also has some inconsistency in their past, and their odds of making it all the way to Super Saturday are shaky: it only happened in 56% of the simulations.
There are a few major shortcomings to this approach that will hopefully be ironed out in the skeesons to come. First, you’ll see that I haven’t taken lane into account in any of these matches. This will definitely be a feature of future Skee Nerd posts – what teams are good on what lanes? Which are bad? What factor is most important for lane-specific effects: going for hundos, banking, or just randomly convincing yourself that you suck on Lane 2 without any logical underpinnings? This is important, for example, because teams with great hundo rollers may be more likely to be better than their average on Lane 3, altering their performance distributions if that’s where they play their match. I’ll probably be able to more accurately predict teams’ scores once I factor lane in. But it’ll never be perfect. It’ll also be interesting to look at what stage of the skeeson different players are good and bad during: if we consider another Choke Artist, John Polischoke, is his performance better in the beginning of the skeeson, in the end, or is he just bad all the time? [Editor’s Note: more shots! Sadly, Polischoke is actually at his best in the playoffs.] We’ll have to wait to find out.
Reminder: check out the app here to see your team’s chances of winning! Play around with the settings to see how likely you are to win if you’re playing one team vs. another. Check back after the playoffs and see how well you think it held true.
* Choking not factored into simulation
** This is an interesting feature that future versions of this analysis will try to account for: If you perform well or poorly in your first round of the playoffs, does this suggest you’re likely to do well or poorly in future rounds? Is this true for all teams, or just some? Once we feed more data into the system, we’ll be able to know.